Sitting in traffic makes you wonder, how do cities even fix this? In 2026, authorities use traffic data collected from sensors, apps, and connected cars to make decisions on roads, jams, safety, and rules. They don’t guess, they measure.
For example, Pittsburgh has updated its signal timing with AI, using real-time feeds to cut waits for buses and reduce congestion. North Carolina also blends highway sensor data with app-based insights to manage corridors in near real time, helping ease heavy truck delays.
This matters because the same road can act fine on Tuesday and pile up on Friday. So, officials compare patterns across hours, locations, and seasons, then choose upgrades that match where problems grow.
In the sections ahead, you’ll learn how authorities use traffic data for decisions, including what they track, how they spot risk, and how that data turns into smarter planning and enforcement.
Where Does All This Traffic Data Come From?
Traffic data doesn’t come from one magic source. It comes from a mix of “roadside eyes,” “carried in your pocket,” and “shared by vehicles.” Put together, these streams give authorities a usable picture of what drivers see, what planners need, and what operators must fix.
In 2026, the most common sources still fall into two buckets: physical infrastructure (like sensors and cameras) and mobile plus connected data (like apps and vehicle systems). Then, behind the scenes, everything flows into Transportation Management Centers (TMCs) and GIS platforms, where analysts and AI models turn raw signals into decisions.
That’s why the same road can look calm in the morning and chaotic at lunch. Data sources capture different slices of the trip, and when those slices combine, patterns pop out.
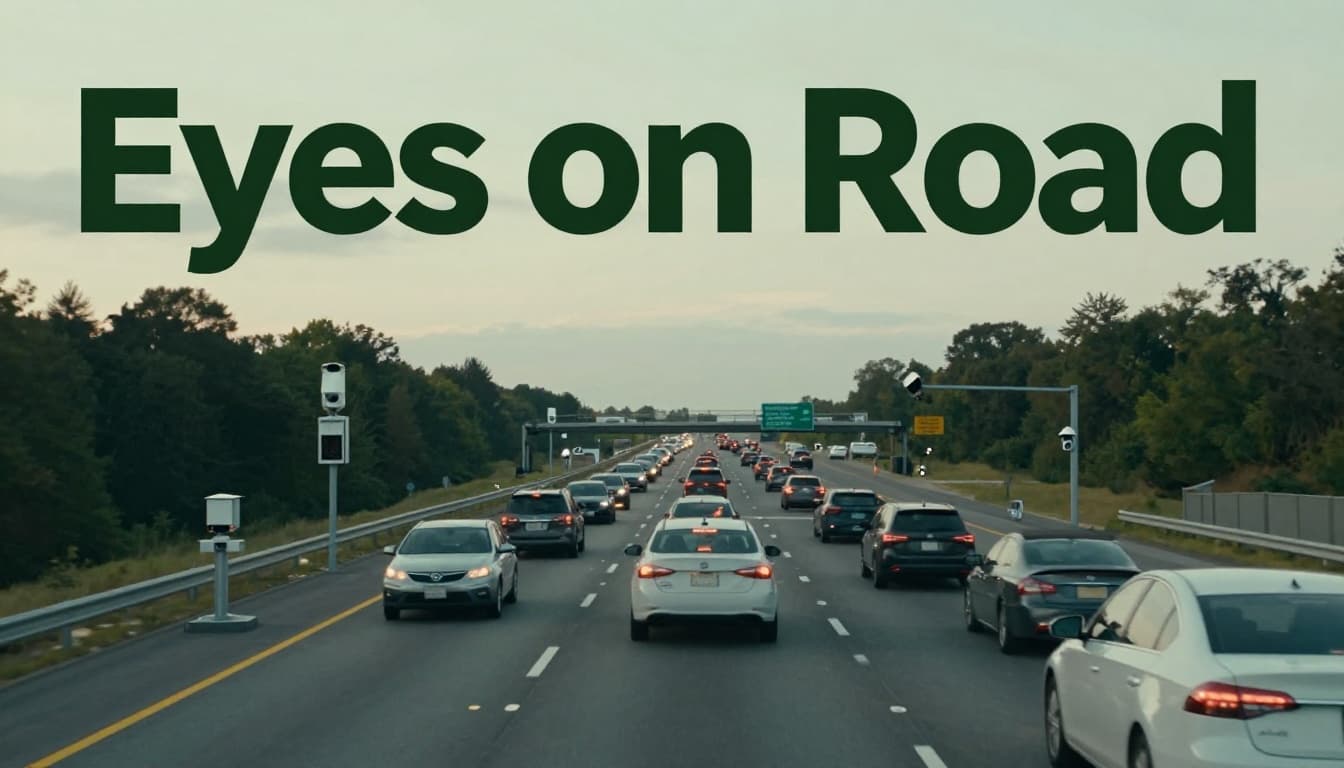
Sensors and Cameras: The Eyes on the Road
Road sensors and cameras give authorities ground truth. They measure traffic where the problem actually happens, like a doctor checking vital signs in real time. You can think of them as the road’s permanent watch team.
One of the classic tools is inductive loops. These are thin wire loops installed under pavement. When a vehicle passes over them, the metal changes an electrical signal. Transportation teams use that change to estimate vehicle counts, occupancy (how much time the detector is “covered”), and often speed based on the time between detection points. Even today, loops still matter because they work day and night without relying on drivers’ phones.
Cameras add another layer. Many cities use cameras mounted at lights and on bridges to detect vehicles, crashes, and blocked lanes. Depending on the setup, software can estimate speed, recognize queueing (cars stacking up), and flag incidents like stopped vehicles. Authorities often pair camera feeds with nearby detectors to reduce false alarms, since one sensor alone can miss context.
To make alerts fast, many systems use edge computing. That means parts of the analysis happen near the roadside, not miles away. So instead of sending every raw video frame upstream, the local system can summarize what it sees, then transmit smaller, quicker updates to the traffic center.
If you want an example of how infrastructure sensors evolve, the Federal Highway Administration publishes guidance on where traffic monitoring happens and why location matters for data quality through the FHWA traffic monitoring location policy.
Finally, these roadside sources feed into TMC workflows. Operators and software push alerts into shared maps, where dispatchers can verify, then plan action, like incident response and signal timing changes. The key point is simple: sensors and cameras tell you what’s happening at the curb, at the lane, at the minute.
Apps and Connected Cars: Crowd Power
Apps and connected cars turn millions of private trips into public signal. They do it by collecting location and travel behavior from drivers, then summarizing it in ways authorities can use. It feels less like watching one intersection and more like listening to a whole room talk at once.
Navigation apps can provide anonymized speed and travel-time data. When enough drivers pass through a corridor, the system can estimate typical congestion levels. It also helps with incident detection, because sudden slowdowns often show up before an operator notices. Companies may refine results using historical baselines, so one odd event does not trigger a false alarm.
Ride-sharing adds another pattern source. Authorities can use ride and trip demand signals to understand where congestion builds between neighborhoods and business districts. In practical terms, this can help agencies time bus lanes, adjust signal coordination, and plan detours around events.
Connected vehicles add depth when they share data. These are cars that can communicate things like position, speed, and sometimes braking or hazard status. When vehicles share that information, the traffic center gains a more detailed picture, especially for fast-changing conditions. Even when exact vehicle identity stays protected, the aggregate view can show where lanes tighten, where jams start, and how long they last.
A key idea here is how app data turns into usable updates. Many providers use near-real-time feeds that refresh every few minutes. For example, Waze makes traffic data available to partners via the Waze Data Feed, including reported incidents tied to user reports. That’s one way authorities can detect problems like hazards or construction impacts quickly, then confirm them with other sources.
Once the feeds arrive, they usually flow into two systems together: a TMC dashboard for operations and a GIS map for spatial analysis. GIS helps officials overlay traffic conditions on road geometry, then compare across neighborhoods, corridors, and times of day.
AI plays a big role in turning the data into decisions. Instead of only listing where delays occurred, models can look for emerging patterns. For example, AI can spot that travel times usually spike when weather turns, then predict where delays will spread next. As a result, agencies can stage resources earlier, like adjusting signal plans before a crash fully ripples through traffic.
In short, apps and connected cars give authorities the “moving viewpoint.” They measure travel as drivers experience it, then aggregate that into the same kind of action-ready view roadside systems provide.
Planning New Roads and Fixes for Tomorrow
Planning tomorrow starts with one hard truth: traffic patterns don’t stay still. They shift with jobs, housing, school schedules, freight demand, and even new shop openings. So authorities use long-range forecasts, then map them onto road geometry, neighborhoods, and future growth areas.
At the center of that work is spatial analysis. Think of it like a weather map for driving. Instead of guessing where rain might fall, planners combine many data layers to estimate where congestion will form, where safety risks may rise, and where new capacity will help most.
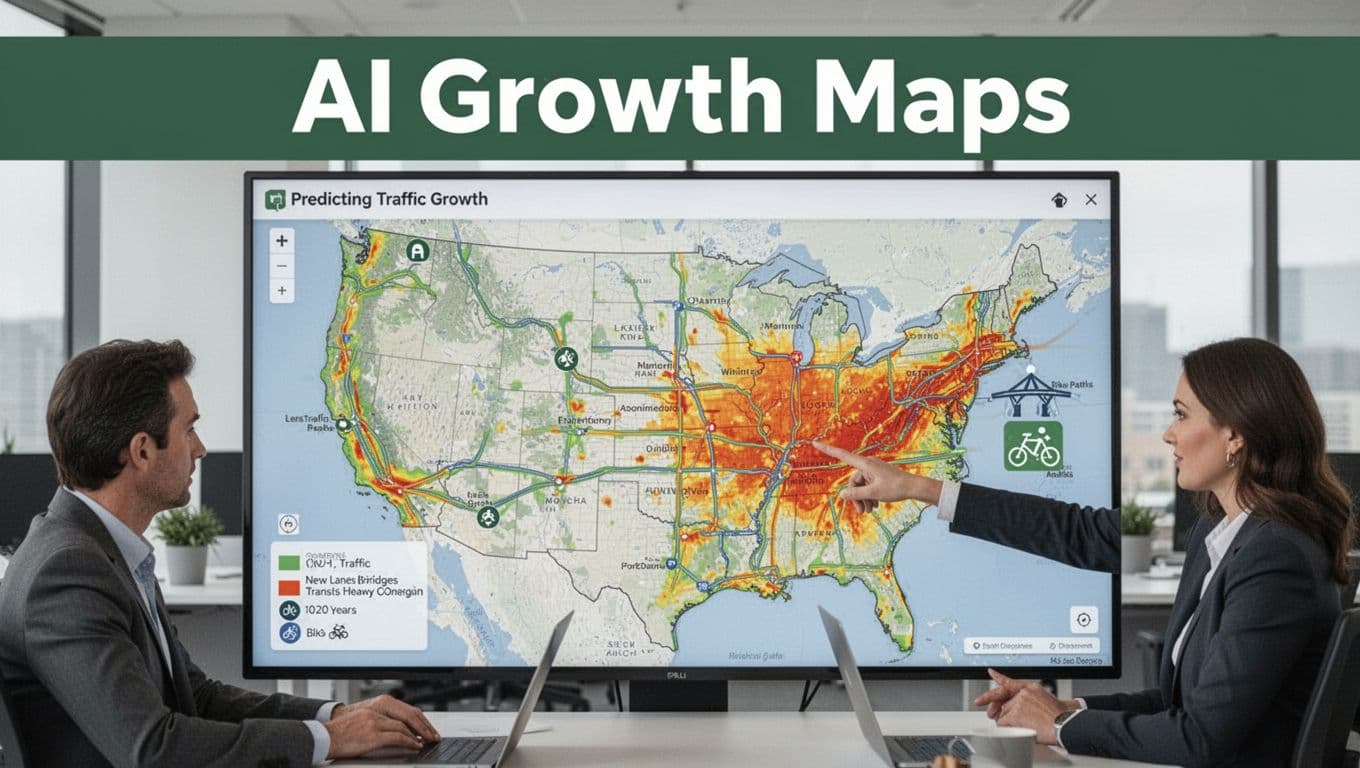
Predicting Traffic Growth with AI Maps
AI maps help agencies look 10 to 20 years ahead, not just months ahead. They start with historical traffic counts, speeds, crash reports, and land-use data. Then they add spatial relationships, like how drivers detour around bottlenecks and how travel demand clusters near jobs and transit.
In practice, planners run scenario forecasts. For example, they model what happens if:
- a growth corridor gains thousands of jobs,
- a new bridge delays construction but opens later,
- freight volumes rise faster than expected,
- a major intersection gets rebuilt with different signal timing,
- transit ridership increases enough to change car trips.
Next, GIS layers make the forecast usable. A model might predict a corridor will get slower, but GIS shows where that slowdown lands. It also highlights which segments matter most, like a feeder road feeding into a highway merge. That matters because building the “wrong” lane can shift congestion without solving it.
Authorities also use AI to account for population shifts. When cities expect new housing in specific zones, AI models can estimate how travel demand shifts across the road network. Then they translate demand into likely traffic growth, using location-based patterns instead of only averages.
From there, long-term data guides big capital choices:
- where to add new lanes,
- which bridges need earlier load and condition planning,
- how to plan transit corridors and park-and-ride access,
- where bike paths and safer crossings can reduce short car trips.
The U.S. DOT GIS Strategic Plan 2026-2030 emphasizes this kind of planning with GIS, AI, and tools like digital twins for testing scenarios before construction. You can see the framework in the U.S. DOT GIS Strategic Plan 2026-2030 (PDF). It also explains how GIS supports safety modeling and infrastructure upkeep.
Finally, predictive analytics connects roads to the economy. When planners estimate fewer future jams, they can translate that into fewer hours stuck in traffic, less wear on pavement, and lower crash exposure. In other words, the map becomes an argument, not just a picture. It helps justify budgets by showing downstream effects, not just upfront construction costs.
Easing Daily Jams with Real-Time Smarts
Real-time traffic tools don’t treat the road like a static drawing. Instead, they watch what drivers do right now, then adjust plans in seconds. When systems respond fast, you get fewer stop-and-go waves, fewer hard slowdowns, and shorter waits at signals.
AI Signals That Learn and Adapt
AI signals do more than “change faster.” They change based on live conditions, then keep refining as new data arrives. That’s the difference between a timer that assumes traffic, and a control system that measures traffic. In Pittsburgh, for example, the city uses AI-powered signals called Surtrac to keep vehicles moving and reduce wasted braking and idling. Reports tied to the deployment cite about a 25 to 26% drop in travel time and around a 21% reduction in emissions, along with large reductions in time lost at red lights.
What makes systems like this feel smoother is the feedback loop. Sensors and cameras spot gaps in traffic. Radar and video help estimate queues. Then the signal plan shifts to match the dominant direction of travel at that moment. If a lane starts filling, the system can extend green phases briefly. If demand drops, it cuts back before drivers pile up.
Surtrac is often described as real-time adaptive control. It monitors traffic movement and uses that information to predict what flows will do next, not just what they did last cycle. You can see an overview from Carnegie Mellon University in Surtrac allows traffic to move at the speed of technology.
On a practical level, this kind of adaptive control targets the pain points that create daily jams:
- Stop waves: fewer “brake bursts” that ripple down the corridor.
- Queue spillback: less spill from one intersection into the next.
- Waste time at reds: green time fits the moment, not the schedule.
Even cities without the exact same setup benefit from the same idea: use live data to run signal changes as short-cycle decisions. Pennsylvania, for instance, describes how transportation agencies apply traffic systems management and operations (TSMO) approaches to improve how corridors work day to day (see PennDOT TSMO strategies). The point is simple: better control means fewer delays you can feel in your body.
Warning Drivers Before Trouble Hits
Adaptive signals help once you’re already moving through the problem zone. Warning systems help before you reach it. That’s where message signs and predictive alerts earn their keep, because they give drivers time to adjust gently instead of slamming brakes at the last second.
Modern traffic centers often use a mix of signals:
- Message signs (DMS) that can change what they tell you in real time.
- Predictive alerts that forecast congestion based on live speeds, queues, incidents, and weather.
- Ramp metering guidance that spaces cars entering the highway.
Think of it like a weather app. It’s not just reporting rain after you get soaked. It alerts you while you still have the chance to pick a route, slow down early, or merge calmly.
Predictive alerts typically work from the same ingredients agencies already collect, like:
- travel-time patterns from sensors and probe data
- incident signals from cameras, detectors, and reports
- event timing (construction, sports, major work zones)
- day-to-day “recurring” congestion versus surprise problems
Then the traffic management system acts. It may update signs with queue warnings, adjust variable speed limits, and shift ramp meter timing to reduce merge shock. When the system expects slowdowns ahead, it can prompt earlier speed reductions so traffic stays in a tighter range. For drivers, that often means fewer abrupt stops and less uncertainty.
To understand how performance is tracked for signals and operations, Pennsylvania also publishes on automated traffic signal performance measures through ATSPMS. That matters because warning systems are only as good as their accuracy. If alerts fire too late, drivers still hit the brakes. If they fire too early or too often, people start ignoring them.
The best systems get the timing right by using fast updates and feedback. Speeds change, queues shift, then the warnings refresh. In short, the goal is not just to warn. It’s to warn at the right moment, so drivers can respond smoothly and keep traffic moving.
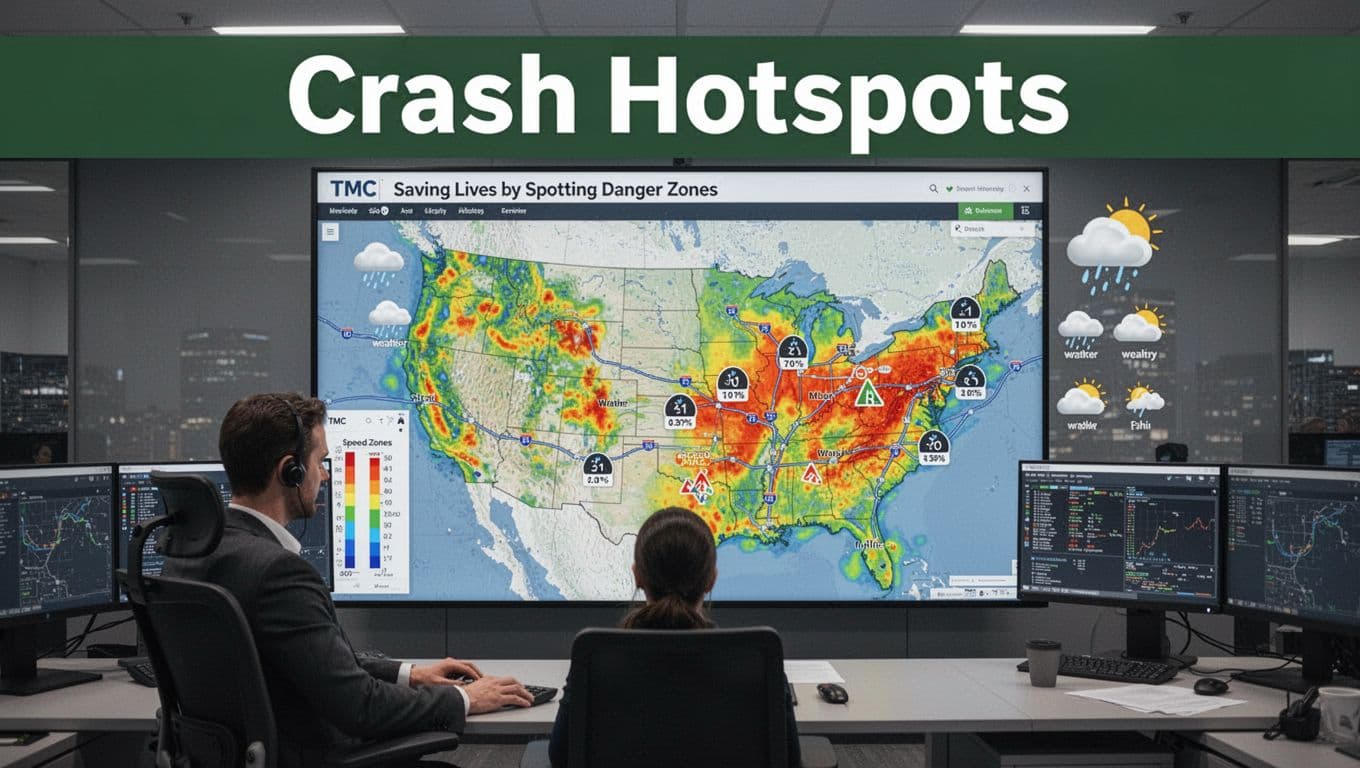
Saving Lives by Spotting Danger Zones
When authorities find a danger zone early, people get to keep going. Crash data does that work by pointing to spots where risk stacks up, not just where delays look bad. Think of it like a smoke alarm, it doesn’t just warn after fire, it helps stop the fire from spreading.
The best programs combine crash records, speed patterns, and weather or surface data. Then they overlay those layers on maps so planners can see “where” and “why” crashes cluster. From there, the next move gets easier, safer intersection fixes, smarter work-zone plans, and better driver warnings.
Mapping Crashes to Fix High-Risk Spots
Spotting crash hotspots usually starts with a simple question: where do crashes happen too often, and under what conditions? Then agencies answer it with data overlays, not guesswork. They take crash locations (often from police reports and state records), add time stamps, and connect that to traffic flow and road features.
In practice, an overlay can show you more than one pattern. One corridor might have high crash counts at the same curve every winter. Another might spike only during late evenings, when speeding and reduced visibility often rise together. That’s how authorities move from “a lot of crashes” to a clear target for action.
Here’s how the pieces fit together.
- Crash location layer: Agencies geocode each crash to a map point or segment. They also note crash type, severity, and road context (intersection, lane, shoulder, crosswalk).
- Speed and traffic layer: Loop detectors, radar, and other sensors estimate speeds and volumes. With that, officials can test whether high speeds match the crash times.
- Weather and surface layer: Data may include precipitation, temperature, and road condition reports. When weather aligns with crashes, it often explains the why.
- Time-of-day and day-of-week layer: Crashes don’t spread evenly across a week. Many hotspots show clear windows, like commute hours or weekend nights.
- Context layer: Lighting status, signal type, lane geometry, and nearby land use often matter. A corridor near nightlife can look different from a school zone.
Once the overlay is built, analysts look for repeatable patterns. For example, you might see rear-end crashes during sudden slowdowns. Or you might see left-turn crashes concentrated where queues back up. Then agencies rank the locations by risk, not just crash counts.
A credible base matters too. NHTSA maintains resources that support analysis of crash data, including reporting systems like the Crash Investigation Sampling System and national crash reporting through CrashStats. Using consistent data reduces the chance that one bad year or one reporting gap drives the wrong decision.
In many states, hotspot work also happens through repeat meetings and clear action targets. Real-time traffic safety data projects, like those supported by NHTSA and research partners, aim to turn fragmented crash records into usable insights for better safety decisions (see NORC’s Enhancing Traffic Safety Data).
A danger zone isn’t just a point on a map. It’s a pattern that repeats under certain speeds, lighting, and weather.
Turning overlays into safer design and enforcement
After agencies spot a high-risk area, they choose countermeasures that match the crash type. If the hotspot shows speeding at specific hours, speed management can come first. If it shows pedestrian crashes at crosswalks, crosswalk visibility and signal timing often follow. If it shows crashes near work zones, the plan shifts to how crews stage traffic and warn drivers.
Here are common countermeasures that follow directly from hotspot overlays:
- Targeted speed limits and speed management: When crashes cluster where speeds run high, agencies can adjust posted speeds, add enforcement zones, and refine radar-based speed feedback.
- Intersection redesign: If the overlay shows left-turn and angle crashes, agencies may re-time signals, add protected turns, improve channelization, or reduce confusing lane choices.
- Lighting and sight-distance fixes: When the crash pattern matches dark hours, better lighting, high-visibility markings, and brush removal often reduce surprises.
- Signage and driver information: When weather conditions align with crashes, agencies can add earlier warnings and more consistent messages.
- Red-light or stop enforcement: If the hotspot ties to running signals, agencies can pair signal timing changes with enforcement where legal and appropriate.
- Bike and pedestrian safety upgrades: When the overlay flags crossings near high turning volumes, agencies can add protected crossing features and adjust signal phasing.
That last point matters. Many agencies now treat vulnerable road users as part of the same safety map, not a separate project. When overlays show pedestrian risk at certain intersections, they can justify specific changes like protected crossings and clearer cues for drivers.
Work-zone hotspots: planning for the chaos drivers don’t see
Work zones create risk because lane layouts change and drivers need extra time to react. That’s why agencies don’t only look at crash counts. They also map crashes by work-zone type, time windows, and traffic patterns.
Many work-zone studies and guidance emphasize using smart management to reduce both mobility harm and safety risk. For example, the Work Zone Safety Information Clearinghouse highlights how smart work zones use ITS tools for queue and speed management in Smart Work Zones. In the same spirit, agencies can use hotspot overlays to plan where to place dynamic warnings, where to add taper controls earlier, and how to schedule lane changes when traffic is already stressed.
At the national level, NHTSA provides guidance specific to construction zones, including how communications and behavior change can prevent crashes (see Work/Construction Zones). When overlay data shows crashes in the same stretch during storms, agencies can also tighten how they manage visibility, detours, and driver messaging.
In short, spotting danger zones saves lives because it converts data into targeted action. When the overlay points to the conditions, the response can be timed, placed, and designed to match what drivers face.
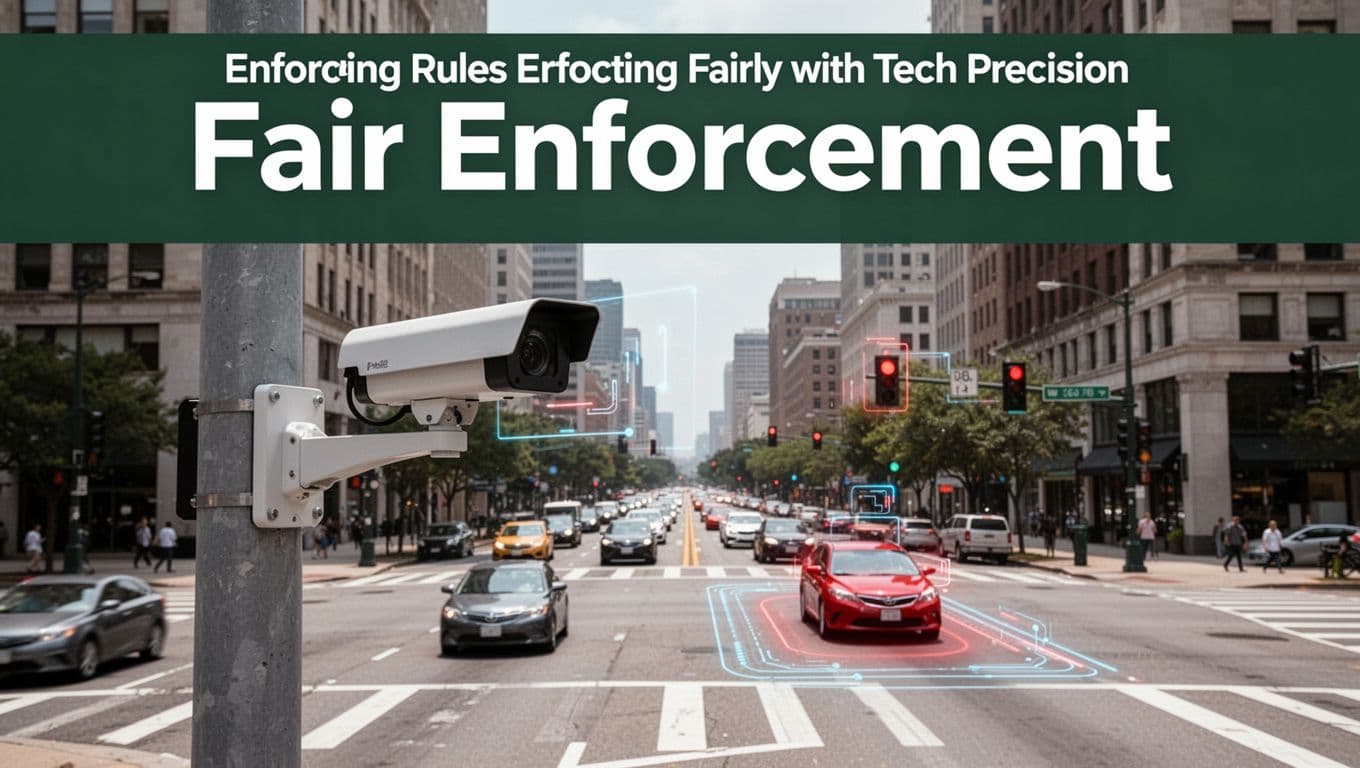
Enforcing Rules Fairly with Tech Precision
When authorities use traffic data for enforcement, fairness depends on more than catching violations. It also depends on precision with purpose: the right system, in the right place, with clear human checks behind the scenes.
If enforcement feels random, people stop trusting it. If enforcement feels consistent, people change habits. That’s why modern systems focus on better detection, faster processing, and smarter placement instead of blanketing every street with cameras.
AI red-light and speed cameras that reduce “gotcha” moments
Old-style cameras mostly acted like tripwires. They triggered a photo when a car crossed a threshold. Today, many cities use AI vision to understand what happened, not just when something crossed a line.
Here’s the difference that matters for fairness:
- AI targets behavior (like failing to stop, or speeding past a safe corridor), instead of relying only on one sensor event.
- AI can watch the approach and the conflict (lane position, timing, and vehicle movement), which helps reduce false flags.
- Human review still plays a role in many deployments, so errors get caught before tickets go out.
Speed enforcement also benefits. If the system can estimate speed from multiple frames, it can better separate true speeding from odd cases like vehicle occlusion or glare. In practice, this moves the program from “capture and hope” to “detect and verify.”
As AI enforcement expands, public trust becomes part of the job. Some reporting highlights how cities and vendors frame the shift toward AI, while also stressing the need for clear rules and review processes (for example, see When AI Starts Writing Traffic Tickets: Cities Using AI Cameras). That framing matters, because drivers care about accuracy, not just automation.
Still, the key fairness principle stays the same: the system should explain what it saw in a way a reviewer can check quickly.
Edge processing that speeds up reviews and speeds up corrections
Speed matters in enforcement, but not because tickets feel urgent. It matters because when decisions take too long, agencies struggle to correct mistakes. Also, outdated workflows can make it harder to audit outcomes.
That’s where edge processing comes in. With edge processing, the heavy work runs close to the camera. Instead of sending every video feed to a far server, the camera unit filters events, then forwards only the moments that likely matter.
In a well-designed setup, the camera captures raw data, then runs checks on the spot:
- Detect the violation candidate (for example, red-light entry or speed threshold crossing).
- Track the vehicle path and timing across frames.
- Produce a short evidence package for review.
- Send that package to a central workflow for final handling.
Because the evidence package gets created fast, reviewers spend time on the cases that truly need judgment. That means fewer delays, and fewer chances that staff will miss something due to slow, overloaded systems.
It also improves corrections. If a pattern shows a specific camera angle leads to higher error rates, the agency can respond sooner, updating placement, settings, or review rules.
Many cities are upgrading camera networks and capabilities, especially where plate issues (like difficult reads) or high violation volumes strain older systems. For example, coverage of major city deployments shows how agencies expand camera counts and upgrade equipment over time (see City to add red light cameras at 450 intersections in 2026). Better hardware plus edge filtering can reduce the “noise” that creates fairness problems.
Data-driven placement replaces blanket coverage with targeted enforcement
Fair enforcement is not just about detection accuracy. It’s also about where enforcement happens. When cameras cover every lane and corner, people see it as revenue collection. When cameras target known risk, people see it as safety.
So how do authorities choose placement with tech precision?
They use layered data, then they look for repeatable conditions. For example, agencies often combine:
- Crash and near-crash records (where harm repeats, not where headlines happen)
- Traffic patterns (peak approach timing, queue formation, turning movements)
- Violation history (counts, times, and vehicle types)
- Road design features (sight distance, signal timing, lane geometry)
- Environmental effects (lighting, weather, glare, construction staging)
Next, they test whether enforcement matches the problem. If red-light running spikes at specific approaches, the camera placement should match that approach, not a nearby intersection “that also seems busy.” If speeding rises near school areas, the plan should connect to school zone behavior and timing, not general highway traffic.
This is also why data-driven placement can improve consistency. Instead of switching policies every year based on politics, agencies can keep a method grounded in evidence. They can also run audits, showing that camera locations align with risk and violation patterns.
Public conversations about AI enforcement often focus on whether machines replace judgment. But placement decisions determine much of the fairness experience before any ticket gets processed. Coverage on algorithmic enforcement frequently notes that these systems are evolving beyond simple photography, and that oversight frameworks matter (see Your Next Red-Light Ticket Might Come From AI). Placement is where that framework shows up in the real world.
Meanwhile, funding and program rules can also affect how widely cameras roll out. Reporting on federal support and limits shows that policy choices shape adoption pace, which in turn shapes how data teams plan camera coverage (see US DOT looks to limit traffic safety camera funding).
Connected-vehicle trials: using car-to-road signals to prevent violations earlier
Cameras catch violations after the fact. Connected-vehicle trials aim to reduce violations before they happen.
In early-stage efforts, systems use vehicle-to-infrastructure (V2I) communication. Cars share basic movement data with roadside units. In return, roadside tech can send warnings tied to conditions ahead, like school zone speed, work zone slowdowns, or safer merge patterns.
In 2026, these trials mainly support prevention and warning instead of large-scale ticketing. Authorities still rely heavily on automated enforcement like AI cameras and roadside detection, because connected-vehicle coverage varies by fleet size and vehicle adoption.
So what does “fairness” look like in connected-vehicle trials?
It looks like using the tech to warn everyone who can receive it, while continuing proven enforcement for the rest. It also means pilots must avoid bias based on who has the newest systems. If only certain drivers get warnings, the program can feel uneven.
Still, these trials can support precision with purpose. When the goal is earlier warnings and smoother speed transitions, you reduce hard braking events, reduce confusion, and give drivers a fair chance to correct course.
For enforcement programs, that’s the real promise: tech that treats safety as the first outcome, and penalties as a last step.
Real Wins, Tough Hurdles, and What’s Next
So, what does progress look like when cities actually use traffic data for decisions? You get real wins in smoother commutes, fewer delays, and safer operations. At the same time, you hit hard limits like privacy rules, aging systems, and tight budgets.
The best programs treat traffic data like a newsroom, not a guess. They collect signals from the road, sanity-check them, then push changes into operations fast. When that loop works, the road starts behaving more predictably.
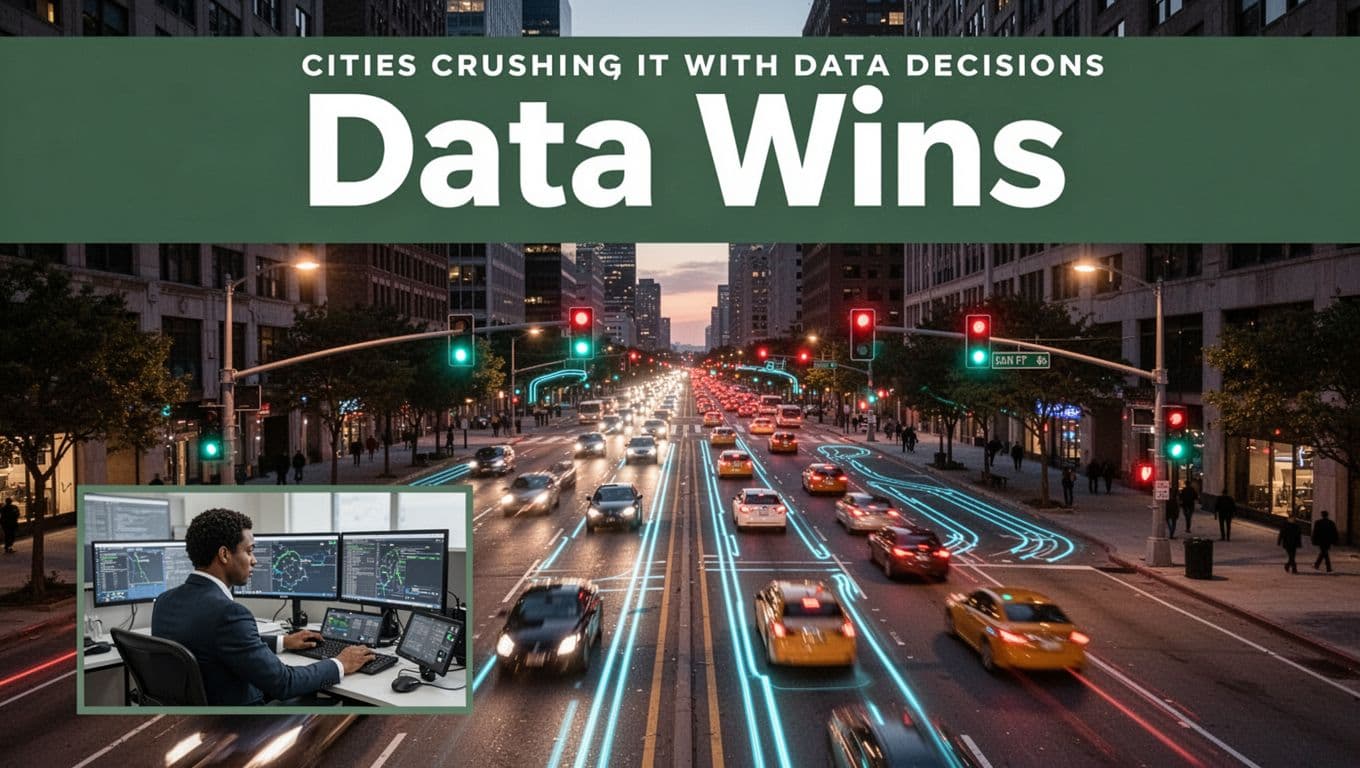
Cities Crushing It with Data Decisions
Some cities are turning traffic data into measurable outcomes, not just dashboards. Pittsburgh stands out for how quickly it expanded from small pilots into a bigger network of adaptive signals. In 2012, it began with Surtrac at a handful of intersections. By 2016, the city expanded to 50 intersections and reported big drops in travel time and idling, along with lower emissions.
If you want a quick way to understand why this worked, picture a traffic signal like a metronome. Old systems keep time based on assumptions. Surtrac, powered by live data, adjusts timing as conditions change. So instead of creating stop-and-go waves, it helps keep flows closer to steady.
Pittsburgh also kept improving. Over time, it upgraded pedestrian timing, added monitoring tools, and refined predictions for what would happen next. If you want a deeper look at the Surtrac work, Carnegie Mellon’s technical coverage on the Pittsburgh deployment explains how upgrades targeted both performance and real-world needs (including pedestrian considerations) through smarter monitoring and extensions in the system (see Surtrac Pittsburgh pedestrian upgrades).
North Carolina, meanwhile, has pushed Integrated Corridor Management (ICM) as a way to manage congestion across key highways using coordinated operations between traffic centers. For a concrete example, the U.S. DOT ITS Deployment Evaluation briefing highlights that North Carolina’s ICM work between its two largest TMCs reached an estimated benefit-cost ratio of 2.95. That’s the kind of number decision-makers want, because it connects data-driven operations to real value (see Next Generation TMCs and transportation systems).
Kentucky’s KYTC shows another win, this time focused on smarter traveler information using probe data. In an ITS Deployment Evaluation, KYTC is noted for discontinuing its 511 program and partnering with Waze for traveler info, while saving about $750,000 per year. The lesson is simple: when you pick the right data feed, you can improve what drivers see and reduce what the agency spends to keep doing it (see KYTC probe and crowdsourced data).
These aren’t just tech stories. They share a pattern: teams used data to reduce friction where people feel it most, then kept tuning based on what the data showed after deployment.
Big Challenges Holding Back Progress
Now for the part that slows everyone down: traffic data projects are not just “buy a sensor and go.” You have to handle privacy, security, integration, costs, and public trust, all at once. One weak link can stall the whole chain.
Start with privacy. Traffic data often combines location signals, readings from roadside systems, and sometimes phone-based insights. Even when agencies protect identities, people worry about what could be traced back to them. The hard reality is that privacy rules can limit how agencies share data across departments or outside vendors.
Then there is cyber risk. Transportation systems run on networks, and networks get attacked. In 2026, threat actors focus on remote access tools, vendor systems, and “human gaps” like phishing. If a traffic center’s tools get compromised, the damage can spread fast, because the system controls real-world operations.
Integration is another wall. A traffic management center might rely on sensors, cameras, GPS probes, incident logs, and crash reports. Those sources often use different formats, update at different speeds, and live in separate systems. As a result, analysts spend time cleaning data instead of acting on it. Even basic tasks, like matching an incident report to the right traffic signal timing record, can turn messy.
Costs also shape what gets built and what gets delayed. Many agencies have aging controllers, limited IT staff, and hardware that needs replacement. Even when the operational side wants AI tools, procurement rules and staffing constraints can slow deployment. Also, maintenance costs matter. Data pipelines need upgrades, storage expands, and model monitoring becomes an ongoing expense.
Finally, trust issues can derail progress even when the tech works. When people see enforcement cameras or “AI-based alerts,” they often ask two questions: Is it accurate? and Who can use my data? If agencies do not explain decisions clearly, public pushback rises. That pushback can affect funding, policy approvals, and how willing agencies are to expand pilots.
A practical way to think about it is this: data-driven traffic management is a chain. Privacy, security, integration, and trust are links. When one link breaks, the chain doesn’t just weaken, it fails.
The most successful programs plan for public trust from day one, not after the first rollout.
Because of these hurdles, authorities often take a staged approach. They improve one corridor, validate outcomes, tighten cybersecurity, then expand when the program proves it can operate safely and fairly.
Trends Set to Transform Traffic Soon
The next wave of traffic data use will feel more adaptive, more spatial, and more predictive. You’ll see connected and autonomous vehicle (CAV) inputs grow, GIS map coverage expand, and control systems get better at adjusting in real time. The goal stays the same: reduce congestion and improve safety, with fewer surprises for drivers.
One major trend is broader use of CAV data and vehicle-to-everything (V2X) style signals. Instead of only observing vehicles after they enter a bottleneck, future systems can get earlier warnings about what’s coming. That matters during incidents and weather, where delays spread quickly. In the best scenarios, roads get “pre-informed,” so traffic lights and traveler messages react earlier.
Another trend is dynamic controls that respond across modes, not just cars. Signals increasingly coordinate for transit priority, pedestrian timing, and smoother merges. Over time, you can expect more “smart zones” where controls shift based on time of day, weather, and event conditions. Think of it like adjusting a home thermostat by room demand, not by a single schedule.
GIS will also play a bigger role. When traffic data sits on maps that match the real road network, teams can see patterns more clearly. They can compare corridors side by side, identify recurring risk segments, and run scenario analysis with better accuracy. Pair GIS with predictive analytics, and you can test what-if outcomes before crews spend money.
AI simulations and digital twins are moving from research into operations. Agencies model a corridor, then simulate how traffic responds to closures, construction phasing, or signal timing changes. With enough validated inputs, the simulation becomes a planning tool that helps teams choose the option most likely to reduce delay and improve safety. In disaster situations, that same capability supports faster planning when roads change quickly and demand shifts overnight.
Emergency response is a standout use case for advanced traffic data. The U.S. DOT National Transportation Recovery Strategy outlines how the transportation system recovers after major disruptions, and it supports planning that uses better information to manage recovery needs (see National Transportation Recovery Strategy). As agencies modernize data, traffic management becomes more than daily operations. It also becomes a way to reduce chaos during evacuations and major disruptions.
On the enforcement side, trends point toward smarter, more context-based decision tools. Instead of relying on a single frame or a single threshold, systems will increasingly combine sensor signals, approach behavior, and timing context to reduce false flags and improve review workflows.
Still, the “what’s next” comes with conditions. Cybersecurity must keep up. Data governance must stay tight. Agencies will need training for operators and clear rules for how data informs actions. When those pieces align, traffic data stops being a record of problems and starts becoming a tool to prevent them.
Conclusion
Traffic decisions in 2026 come down to one repeatable move, authorities collect traffic data, then use it to plan, reduce congestion, improve safety, and run enforcement with clearer targets. They measure what’s happening now, forecast what will happen next, and map it all in ways operators can act on quickly.
AI and GIS matter because they connect patterns to places, so agencies don’t just see delays, they spot causes. When systems learn from real-time signals and crash trends, they can adjust traffic lights, guide traveler info, and focus safety fixes where they reduce risk the most.
If you want better roads, support data-driven policy, and use traffic apps to contribute timely signals through travel-time and incident reporting. Which traffic problem would you want authorities to solve first, daily queueing at signals, repeat crash hot spots, or enforcement that targets known risk fairly?