You’ve probably felt it on your commute. A jam forms where it shouldn’t, lights stay stuck on red, and the trip takes longer than it should. Behind the scenes, traffic engineers collect traffic data from sensors, cameras, and radars to spot those problems early.
But here’s the real question: what happens to traffic data after it is collected? The short answer is that the data doesn’t just sit in a folder. It gets stored safely, cleaned up, turned into useful insights, and then used to make roads work better.
In the process, cities also have to protect privacy. That matters because traffic data can include details that could identify people, even when the goal is simply to improve flow. So the systems that handle the data must balance public safety with data protection.
In this guide, you’ll see the journey from raw counts to smarter decisions. First comes storage, then processing, then real-world uses for smoother rides and fewer crashes. After that, we’ll cover privacy protections and the latest trends shaping traffic systems in 2026.
How Traffic Data Finds a Safe Home in Storage
Once traffic data is collected, it needs a place to live. Not just any place, either. It has to handle huge volumes, keep data accurate, and let teams pull the right files quickly.
A lot of traffic systems start with simple formats. For example, agencies may export vehicle counts, speeds, and vehicle types into CSV or Excel files for quick checks. That works well for small studies and short time periods. Still, when the data comes from thousands of sites (or high-volume video feeds), spreadsheets become hard to manage.
So teams often move toward databases and other systems built for speed. Instead of storing every measurement as a separate file, they store data in tables that can be queried fast. That makes it easier to answer questions like, “How did speeds change at this intersection during the last two weeks?”
Here’s a helpful way to think about it: storing traffic data is like organizing photos on your phone. If everything sits in one big pile, you can’t find what you need. If it’s sorted into the right folders (and backed up), you can grab it fast when you need it.
Tiered Storage for Big Volumes
Traffic data can hit massive sizes. Sensors watch continuously, radars log per lane and per minute, and cameras can generate heavy video or extracted features. Because of that, many agencies use tiered storage.
The idea is simple. You keep the most important details in faster storage, while less-used data goes to slower, cheaper storage.
For example, agencies may keep full detail for short periods. Then they store daily or hourly summaries longer-term. That reduces costs without losing the ability to study trends later.
| Storage tier | Typical data | How it’s used |
|---|---|---|
| Fast tier | Recent minute-by-minute speeds, counts, lane data | Near-real-time traffic management |
| Mid tier | Hourly or daily aggregates | Weekly performance checks |
| Long-term tier | Archived snapshots, reports, computed metrics | Planning, audits, reporting |
This approach matters because traffic operations often need answers in seconds, not days. Meanwhile, planning teams need history, not just a live view.
Databases and Tools for Easy Viewing
After storage, the next job is access. If the data can’t be found, it can’t help anyone.
That’s why many teams use tools like dashboards and time-series queries. Instead of sorting through raw files, analysts can view trends over days, months, or years. They can compare peak vs. off-peak performance, check changes after a signal retiming, and track whether safety improvements actually held up.
As a baseline, U.S. DOT guidance supports consistent monitoring and calculation practices. For instance, the FHWA 2022 Traffic Monitoring Guide outlines how agencies should think about traffic monitoring and data quality. That guidance helps teams keep results consistent across projects and regions.
Still, good storage is only step one. Raw data often has gaps, errors, or formats that don’t match. Next comes the processing path.
From Raw Numbers to Smart Insights: The Processing Path
Collecting data is only part of the story. Data also has to become trustworthy.
Think of the processing path like cooking. You don’t just pour ingredients into a bowl and call it dinner. You clean, measure, and adjust so the final result makes sense.
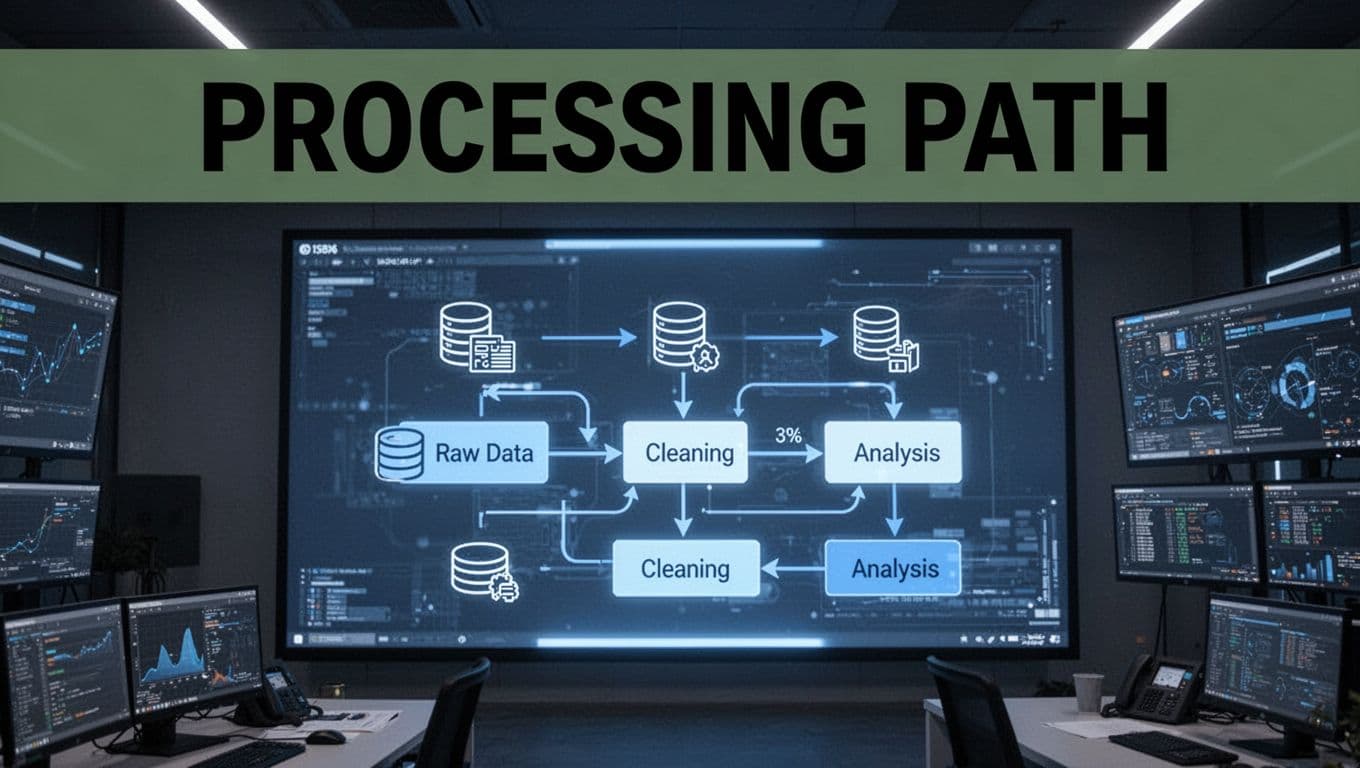
Most traffic workflows follow a similar flow, even when the exact tools differ by agency:
- Raw collection from radars, cameras, loops/tubes, and sometimes manual counts
- Upload and extraction, where systems pull out useful features from each source
- Analysis, where teams compute volumes, speeds, occupancy, and patterns
- Reporting, where charts and metrics turn results into decisions
In practice, AI tools can speed up tasks like sorting video-derived events or flagging suspicious sensor output. Then human reviewers confirm what they see. That mix helps catch issues early.
Uploading and Cleaning the Data
Raw traffic data often arrives messy. Sometimes it’s missing. Sometimes it’s duplicated. Sometimes a sensor drifts out of calibration.
So cleaning usually includes checks like these:
- Range checks (for example, speed values that look impossible)
- Consistency checks (for example, lane counts that don’t match typical patterns)
- Timing checks (for example, data stamps that don’t line up)
- Format normalization (for example, different sources using different units)
If cameras are involved, systems may extract features like vehicle presence or movement, then remove frames that are too blurry or too dark to be useful. If radars provide lane-level data, the processing layer aligns it to the correct roadway segment.
U.S. DOT technical material also covers traffic monitoring procedures. For more detail on how agencies handle monitoring steps, the FHWA HPMS Field Manual Appendix F, Traffic Monitoring Procedures explains practical approaches used for consistent data collection and handling.
Uncovering Patterns with Analysis
Once the data is clean, the real work starts. Analysts and algorithms compute metrics that people can act on.
Common outputs include:
- Average speeds by time of day
- Peak-hour volumes and turning movements
- Travel time estimates (when enough data sources exist)
- Occupancy or congestion indicators for segments and corridors
Then patterns show up. A consistent slowdown before a specific exit might point to a bottleneck design issue. Frequent drops in speed after a traffic signal change might mean timings need adjustment.
In some cases, teams use models to predict risk. They might look at combinations like high exposure plus repeated hard braking patterns. That’s how agencies can move from “we saw a crash after it happened” to “we can spot risky conditions sooner.”
The end goal is decision-ready information. You won’t see every step inside every city dashboard, but the pipeline exists so actions can happen fast.
Who Puts Traffic Data to Work and How
So who uses traffic data after processing? The answer is: a mix of public teams and private providers.
Government agencies rely on traffic data to keep roads safe and efficient. Private companies often sell tools, analytics, and hardware services. Some work with cities directly. Others support logistics firms, ports, and mobility operators.
Where does it show up in daily life? You may never notice it directly, but you feel it when signals adjust, when construction schedules change, or when agencies spot a recurring issue at a key intersection.
Government Teams Building Better Roads
State DOTs and city DOTs use traffic data in a few big ways.
First, they prioritize road projects. If data shows a corridor struggles during certain times, that corridor becomes a candidate for lane changes, signal upgrades, or safety improvements.
Second, they manage traffic systems using Transportation Management Centers (TMCs). These centers monitor live conditions and coordinate incident response. With better data, operators can respond sooner and coordinate more accurately.
Third, traffic data supports emissions and safety goals. When flow improves, vehicles spend less time idling in stop-and-go traffic. That can reduce both congestion-related delays and some types of pollution impacts.
The broader push toward modern TMC capabilities is well covered by ITS program reporting. For example, see Next Generation Transportation Management Centers and Transportation Management Systems. It highlights how agencies use new data sources for improved corridor awareness.
In short, traffic data becomes a practical guide for what to fix, what to fund, and when to act.
Businesses Turning Data into Services
Companies also turn traffic data into products and services.
Some provide sensors, radars, cameras, or installation services. Others provide analytics platforms that help cities and agencies interpret mobility patterns.
In other cases, the data supports logistics. If freight routes rely on reliable travel times and bottleneck detection, better traffic analytics can reduce wasted trips and late deliveries.
The road network is one system, but it’s also many systems at once. That’s why data becomes valuable beyond city limits. With the right tools, traffic data helps planners evaluate corridors, supports safety analysis, and can help develop smarter roadway operations.
Still, using traffic data requires more than technical skills. It also requires trust. And trust starts with privacy.
Keeping Drivers Private While Using the Data
People often worry about surveillance when they hear “traffic data.” They wonder if someone is tracking their location, reading license plates, or storing personal identifiers.
Those worries are understandable. Traffic systems can collect information that relates to individuals, even when collected for public safety.
That’s why privacy protections are part of the processing pipeline, not an afterthought.
A common goal is useful aggregate data without personal identifiers. In other words, agencies want totals and patterns, not a list of who did what.
Smart Ways to Hide Personal Details
Privacy protections vary by project, but they often follow these themes:
- Aggregation instead of identity: storing totals like “500 vehicles per hour” rather than individual movements
- Data minimization: keeping only the fields needed for the analysis
- Removing direct identifiers: stripping or avoiding plate-level or person-level identifiers
- Summarizing video outputs: extracting features (like counts) instead of retaining raw video longer than necessary
One way to think about it is this. The system should answer “what’s happening on the road?” without answering “who exactly was on the road?”
The DOT also publishes a privacy policy that explains how the department protects personally identifiable information across its data lifecycle. See the DOT Privacy Policy for the core principles behind collecting and using data responsibly.
Some projects go further with specialized tools for privacy protection. For example, the U.S. DOT ITS Joint Program Office has open code for a Privacy Protection Application (PPA) on GitHub. It focuses on hiding sensitive locations in trajectory-like data using processing methods. You can review the Privacy Protection Application (PPA) on GitHub if you want a deeper look at how privacy can be built into processing.
When privacy is handled well, people are more likely to support traffic tech. And that support matters, because cities need sensors to keep roads safe.
Fresh Trends Shaping Traffic Data in 2026
In 2026, traffic data systems aren’t just collecting more. They’re also working smarter with it.
A big trend is more automation earlier in the pipeline. Instead of sending everything to a central team for review, systems increasingly process and check data on the edge or in near-real time. That can reduce delays, especially for live corridor management.
Another trend is predictive analytics tied to operations. Agencies want early warnings for congestion risk, signal timing needs, or safety patterns. That doesn’t mean “predict everything perfectly.” It means flagging issues sooner so operators can investigate faster.
Connected-vehicle approaches and better integration between data sources also keep growing. Instead of relying on one sensor type, systems can combine data from signals, GPS feeds, weather stations, and camera-derived measurements. That produces a more complete view of what’s happening across a network.
At the same time, privacy and governance are getting more attention. As more sources come in, agencies need clear rules for retention, access, and sharing.
There’s also a push toward more capable management centers. The goal is better situational awareness across corridors, not just at one intersection. That’s where modern TMC concepts connect with newer data sources and improved workflows.
Finally, traffic data is increasingly connected to planning and GIS workflows. Maps help teams understand what the numbers mean in the real world. When data aligns with geography, it becomes easier to plan routes, schedule maintenance, and target safety improvements.
In 2026, the best systems treat traffic data like a living resource. They store it wisely, process it carefully, and use it to improve trips today while learning for tomorrow.
Conclusion
Traffic data after it is collected follows a clear path. It moves into secure storage, then through cleaning and processing, and finally into reports that teams can use.
Along the way, privacy protections help keep the focus on roadway outcomes, not personal tracking. That balance supports trust, which makes it easier to deploy sensors and improve service.
So next time you hit a jam or watch signals run smoothly, remember the data journey behind it. Better traffic data means safer roads, fewer delays, and cleaner commutes.
If you’ve worked with traffic tech, a city project, or even just a local transportation system, share what you’ve noticed. What part of the pipeline seems hardest in your area?