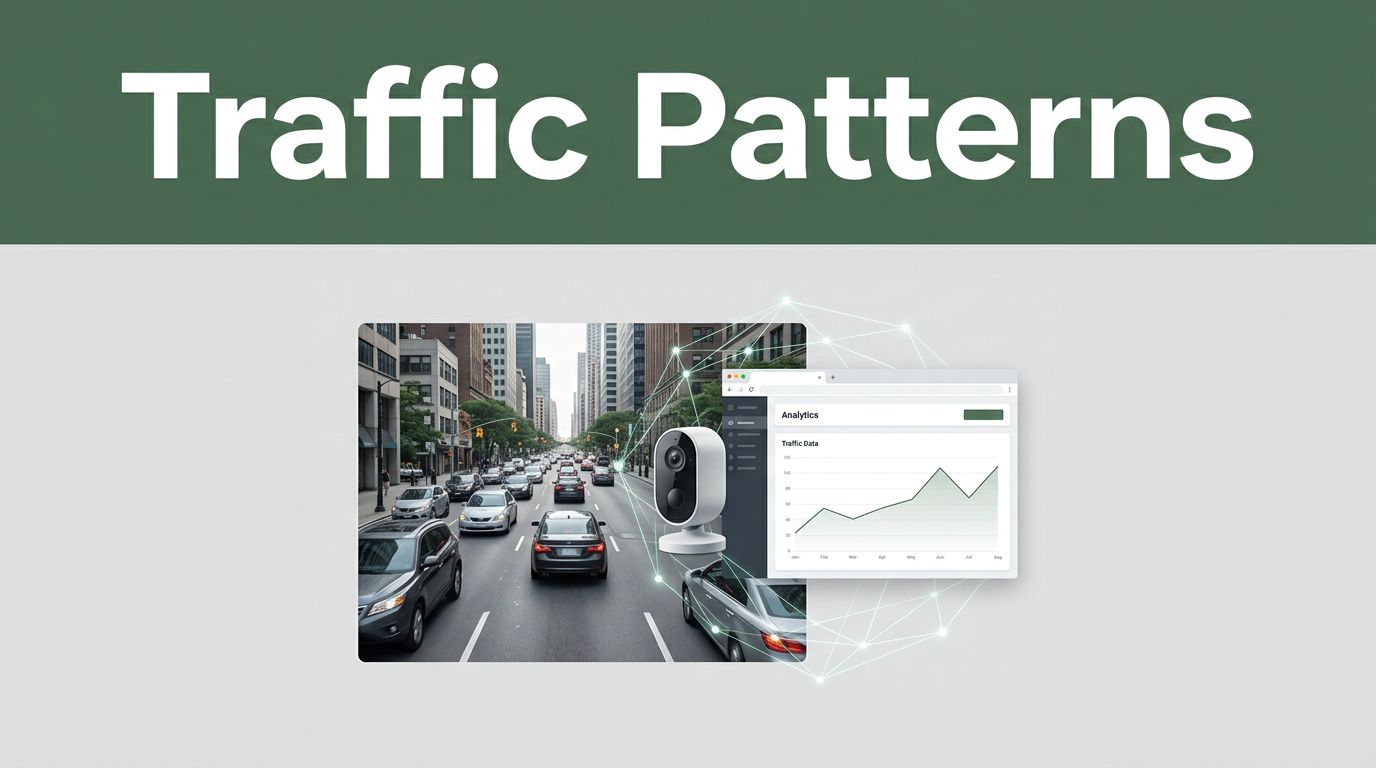
Ever sit in traffic and wonder, “Why is this happening again?” Or notice your favorite site slows down right when everyone shows up. Traffic patterns show up everywhere, from roads to websites to computer networks. The “system” part matters, because patterns repeat, drift over time, and hide behind normal noise.
In simple terms, traffic patterns are the rhythms and flows of movement. On roads, that’s cars, bikes, and pedestrians. On websites, that’s clicks, scrolls, and visits. On networks, that’s data flows between devices.
When you analyze those patterns, you can make smarter signals, smoother routes, safer systems, and better user experiences. Next, you’ll see how modern systems do it, using real methods and tools from 2026, without drowning in tech jargon.
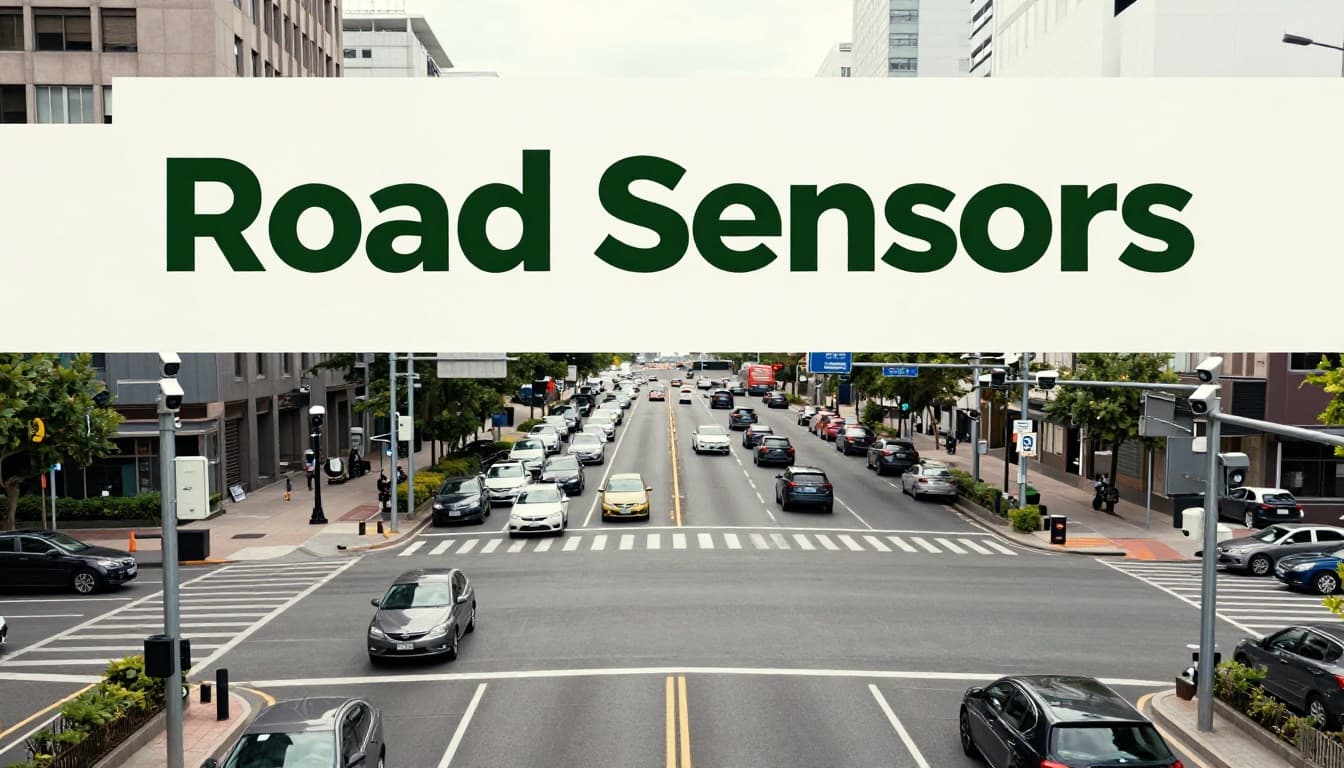
How Smart Sensors and Cameras Uncover Road Traffic Patterns
Road traffic analysis starts with one big goal: measure what’s happening, then predict what might happen next. Cities do this with layered data, not one magic feed.
Cameras count vehicles and classify them. Road sensors measure speed and volume. GPS traces and navigation apps add real-world travel times. Weather adds context, because rain changes braking and lane use.
Once the data streams in, systems look for three things. First, where traffic builds up. Second, when it starts to break down. Third, how it evolves, hour by hour, day by day.
That’s where AI joins the party. Instead of guessing from a single snapshot, models track movement across time. Then they flag jams early, spot unusual incidents, and help engineers test signal changes.
Key Data Sources Feeding Road Traffic Analysis
Cities rarely rely on one sensor type. They combine sources so blind spots shrink. Think of it like tasting soup with one spoon versus several bites. Each sample misses something, but together they tell the full story.
Here are the most common inputs:
- City cameras: Video feeds capture lane-level movement, turns, and queue length.
- Loop detectors and pavement sensors: These measure speed and volume by vehicle passage.
- Radar and lidar: They estimate distance and speed, even in bad light.
- GPS and phone location data: These show travel time, origin-destination patterns, and route choices.
- Navigation apps (like Waze, TomTom, and HERE): They add massive “floating” data from real drivers.
- Weather and special events: Rain, snow, wind, and events shift demand and reduce capacity.
Because the data comes from multiple angles, systems can cross-check it. For example, cameras might show queue length. Radar can confirm speed drop. Weather can explain why braking increased.
If you want a real-world look at how traffic data is turned into numbers, the TomTom Traffic Index shares the “pulse” idea clearly. It’s a reminder that traffic analysis is less about one jam, and more about repeated patterns across many cities.
AI Tools That Make Sense of the Chaos
After data collection, AI helps systems interpret what they see. However, good traffic AI still needs clear tasks. Otherwise, you get charts with no decisions.
A common starting point is object detection in video. Models such as YOLO-style approaches find vehicles frame by frame. Then they count lanes, estimate density, and build tracks over time. That tracking matters because a “slow” lane is different from a lane that’s backing up.
Next comes time-series prediction. Traffic tends to follow rhythms. Mornings and afternoons peak. School zones shift demand. Weekends differ from weekdays. So systems use forecasting methods (like ARIMA-style models or modern neural variants) to predict near-future conditions.
Systems also run anomaly detection. A sudden crash, stopped bus, or blocked lane changes the pattern fast. Anomaly models look for abrupt deviations from normal flow. Then they trigger alerts for operators and downstream systems.
Finally, this information feeds into control. In many cities, traffic lights update based on predicted demand. Signals can adapt when sensors detect early queues, instead of waiting for congestion to become obvious.
A good analogy is coaching. A coach doesn’t just watch one play. They watch the whole game and notice the next trend. Traffic AI does the same, just with data, timing, and constraints.
Real Wins: Cities Putting It into Action
Road traffic analysis becomes valuable when it changes outcomes. That can mean safer crossings, shorter travel times, or better planning for roadworks.
One example is how location data supports targeted planning. For instance, TomTom’s tools let cities analyze congestion over custom areas and timeframes, which helps when they’re testing low-traffic zones or rerouting flows. Their Area Analytics launch describes the idea well: define an area, analyze patterns by timeframe, and compare congestion changes with real data.
In day-to-day operations, cities also use smart sensing for incident response. If sensors show abnormal stops, systems can alert maintenance teams and adjust signal plans to reduce spillover into neighboring streets.
In 2026, another trend is edge AI on cameras. Instead of sending every video frame to a distant server, systems can analyze locally. That cuts costs and reduces delays. It also helps with privacy when cities limit what gets stored.
And as sensing gets better, multimodal systems grow more common. Pairing camera detections with radar speed estimates, plus weather context, leads to fewer false alarms. Put simply, the system “trusts” the signal only when it makes sense together.
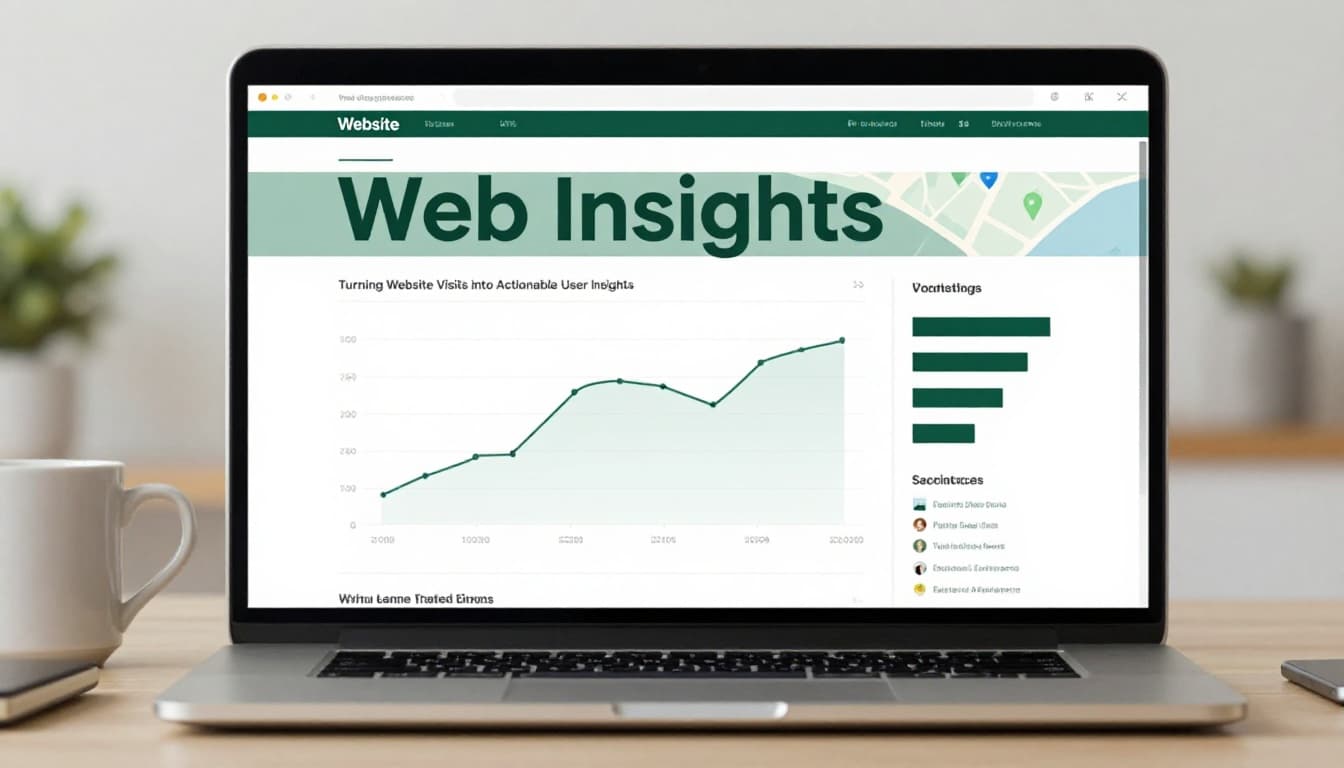
Turning Website Visits into Actionable User Insights
Website traffic analysis works differently than road traffic. Still, the goal is the same: understand movement patterns, then act on them.
On a website, “traffic” includes visitors, sessions, clicks, and time on page. It also includes device type, browser, referral source, and conversion steps. You can measure it from server logs (what the site receives) and from client-side tracking (what the user does in the browser).
Then systems turn raw activity into a few key views:
- What users do (behavior)
- Where they drop off (friction)
- Why patterns change (causes)
That’s how a site can stop blaming “traffic volume” when the real issue is a broken checkout step or a slow page for mobile users.
What Data Reveals About Visitor Behavior
Visitor behavior often looks messy at first. But it usually breaks into clear patterns once you segment it.
Systems pull data like:
- Server logs: request timestamps, IP ranges (often anonymized), response codes, and latency.
- Cookies or consent-based IDs: session continuity and click paths.
- Clickstreams: what pages connect to what pages.
- Device and network info: mobile type, screen size, and connection speed.
- Referral and campaign data: where visitors came from and why they arrived.
The most useful insight is where users hesitate. For example, many sites see a spike in exits right after a form loads. That can point to slow scripts, blocked third-party resources, or a validation bug.
In 2026, privacy rules also change what data you get. Many teams shift toward privacy-first analytics and more reliance on first-party data with user consent. As a result, systems spend more effort on clean event design. They also focus on aggregated reporting instead of individual tracking.
That shift is one reason many teams explore alternatives to older setups. If you’re looking for a practical list of options, web analytics tools beyond Google summarizes how teams adapt as tracking limits increase.
Algorithms That Predict and Personalize
Once you can measure behavior, you can model it.
A common method is segmentation. Systems group users by patterns such as source, device, and browsing sequence. Then they compare conversion rates across groups. This is like sorting guests at a party by what they order. If one group keeps changing their minds at the menu, you fix the menu.
Next, recommendation and personalization systems use algorithms such as:
- Clustering: find similar user journeys.
- Collaborative filtering: recommend based on “people like you” behavior.
- Time-based prediction: forecast what will happen next in a funnel.
Systems also use anomaly detection for problems like bots or sudden traffic spikes. A burst of visits with strange timing, repeated page sequences, or odd user agents can signal automation. Then teams can throttle, challenge, or block those sessions.
Prediction matters because behavior changes fast. In 2026, web traffic can shift because of generative search answers. Many users get a result without clicking. So site teams adjust by building pages that AI systems can reference, and by improving pages that appear in summaries.
Examples from Sites Crushing It Online
Some sites improve results with small but targeted analysis moves.
For example, an e-commerce site might find that product pages drive traffic, but carts stall. Funnel analysis can reveal the exact step users skip. Then the team can fix layout issues, reduce friction in shipping options, or change error messages that confuse shoppers.
A content site might notice that visitors arrive through specific topics, then exit after a slow page element. Performance monitoring plus behavior data can show which section causes delays. After the fix, time on page rises and bounce rate drops.
Streaming and media sites often use recommendations. But the quality of those suggestions depends on pattern learning. If the system sees that certain viewers pause at specific categories, it can adjust what appears first. Over time, personalization improves because the model learns from behavior.
In 2026, another practical shift is privacy-first measurement. Many teams keep fewer signals, but they design those signals better. Instead of tracking everything, they track what leads to actions. That makes analysis more reliable, even when tracking isn’t perfect.
Spotting Network Threats by Watching Data Flows
Network traffic analysis has a scarier version of “traffic jams.” Instead of cars, you see packets. Instead of lanes, you see connections. And the “rush hour” might be a botnet attack or data theft.
The key concept is flow analysis and behavioral baselines. Attack traffic often hides among normal traffic. So systems don’t rely only on known signatures. They also watch for unusual timing, odd destinations, strange volumes, and repetitive login patterns.
In many organizations, the workflow looks like this:
- Build a picture of normal network behavior.
- Compare live traffic against that picture.
- Alert when behavior breaks the baseline.
- Investigate with logs and packet traces.
This is why tools like NDR exist. NDR, or Network Detection and Response, focuses on behavior in network traffic, especially lateral movement and suspicious communications.

Core Data Streams in Network Monitoring
Network analysis depends on collecting the right “views” of traffic.
Common data streams include:
- NetFlow or IPFIX flows: metadata about who talked to whom, when, and how much.
- Packet metadata and summaries: protocol, sizes, and timing (often without full payloads).
- Authentication logs: logins, failed attempts, and session changes.
- DNS logs: domain queries, unusual volumes, and rare patterns.
- Cloud telemetry: VPC logs, security events, and service-to-service calls.
A good monitoring stack builds a normal model from these signals. Then it flags differences. For example, a baseline might show that certain servers rarely talk to new external domains. If that changes overnight, alarms get triggered.
If you want a clearer picture of how NDR fits into modern defense, this guide on Network Detection and Response (NDR) in 2026 explains the “watch behavior” idea and how teams evaluate NDR platforms.
Smart Detection Models at Work
Detection models in networks often combine rules with machine learning.
Rule-based systems handle obvious cases. For example, they might block known bad IPs or enforce strict allow lists for certain traffic types. Those rules help quickly, but they miss new tricks.
Machine learning helps with patterns that rules can’t fully cover. For instance, models can detect unusual spikes in connections, odd sequences of queries, or rare sequences of east-west traffic inside cloud environments. They also help with encrypted traffic scenarios by analyzing metadata, timing, and flow sizes.
Many systems also use rule plus ML combinations. They filter obvious noise, then run deeper checks. That makes investigations faster for analysts.
A simple way to remember this is “guard dog learning barks.” The guard dog learns the sounds that normally happen. When it hears a new pattern, it doesn’t need a name for every intruder. It needs to know that the behavior is off.
Proven Cases Keeping Networks Safe
Network monitoring helps stop several recurring threats.
Some common targets include:
- Malware communication that looks like normal app traffic.
- Data exfiltration where stolen data moves out in small chunks.
- DDoS attacks that overwhelm services by volume.
- Command-and-control traffic that uses repeated patterns to manage bots.
- Suspicious logins that come from unusual locations or devices.
In practice, NDR tools help teams catch these issues earlier. They also give context for investigation. Analysts can see which hosts started talking, which destinations changed, and how the pattern evolved.
Then incident response teams can act. They might contain hosts, block certain traffic, or force resets of credentials. The faster you act, the less damage the attacker causes.
Finally, many networks now integrate NDR alerts into broader systems like SIEM workflows. That way, alerts don’t sit in a silo. Instead, they connect to tickets, timelines, and evidence.
Tools and Trends Powering Traffic Analysis in 2026
By now, you might notice a theme. Road systems, web analytics, and network monitoring all do the same core work. They collect signals, normalize them, then look for patterns. The tools differ, but the job stays familiar.
Here’s a simple way to compare the “traffic types.”
| Area | Goal | Main Data | Typical Tech |
|---|---|---|---|
| Road traffic | Reduce jams and improve safety | Video, sensors, GPS, weather | AI detection, time-series prediction |
| Website traffic | Improve UX and conversions | Clickstream, logs, events, device info | Funnels, segmentation, anomaly spotting |
| Network traffic | Stop attacks and data theft | Flows, auth logs, DNS, cloud telemetry | Baselines, NDR analytics, ML alerts |
As for trends in 2026, three show up across all areas.
First is edge processing. Systems do more analysis near the source. That reduces cost and delay.
Second is multimodal signals. Road systems combine sensors. Web systems combine event types. Security stacks combine flow, auth, and logs.
Third is privacy and consent. Teams design data collection to respect limits. They track what they need, not everything they can.
If you want a signal about where road sensing is heading, the 2026 ITS trends from Ouster focuses on physical AI and lidar-powered improvements. That fits the broader move toward smarter, more spatial sensing and better traffic optimization.
Conclusion
Traffic patterns are the heartbeat behind what you see, whether it’s a stuck commute, a slow webpage, or a suspicious spike on a network. Systems analyze them by collecting signals, turning those signals into models, and watching for change over time.
Road systems blend cameras, sensors, and GPS. Web systems connect clicks and drop-offs to decisions. Network systems track flows and flag behavior that breaks the baseline.
The next time traffic frustrates you, or a site feels sluggish during peak hours, think like a system designer. What data would prove the cause, and what pattern would predict the fix?
If you’re working on improvements, start with one metric tied to a real outcome, then test changes. What pattern are you most curious about right now, roads, websites, or network traffic?